

A study released today by the Harmony Institute* used the premiere of the first season of the Walking Dead as the subject matter for investigating brain activity in popular entertainment. (Read more about the study here.) The study’s central question: Is there a clear connection between neural engagement and Twitter engagement? Here's how they did it, in five simple steps.
1. Choose a good subject
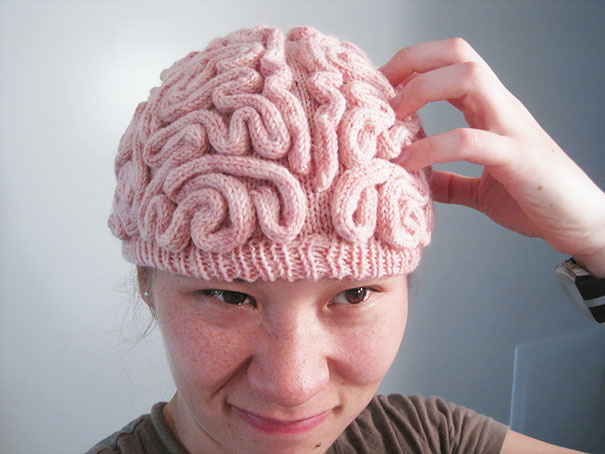
If you were going to choose any show on television as the subject matter for a study on neural engagement, you’d have a hard time picking something better than AMC’s The Walking Dead. Not only is the visceral, blood n’ guts nature of the show exactly the sort of thing likely to excite any available, living cerebral cortex, there’s a fun overlap in doing a brain study using a show so centrally concerned with brains.
2. Don your EEG caps
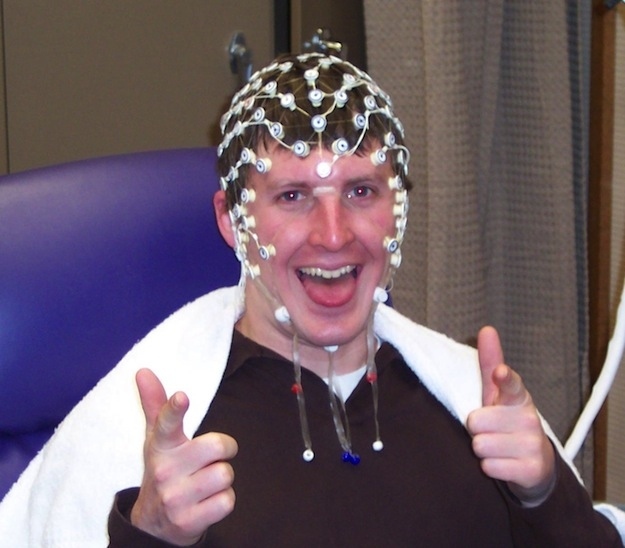
An electroencephalogram (EEG) cap uses hundreds of electrodes, attached to the subject's head, to monitor electrical activity in the brain. It also looks cool.
Working with neuroscientists at Columbia University and the City College Of New York, the researchers compared the EEG measurements of 20 people watching the show for the first time with the collected Twitter data from when the show originally aired, on October 31, 2010.
The subjects were all people who hadn't seen any episodes of the show before. The EEG's measured three areas types of brain waves, those associated with attention, memory encoding and emotion.
3. Compare the data
The key was then comparing the EEG data with the live Twitter data from when the show first aired. Combing back through Tweets about the show that happened as it aired, the researchers collated and overlaid that data with the peaks and valleys of neural engagement from their 20 test subjects.
4. Find the obvious connection: The headshot effect


View this video on YouTube
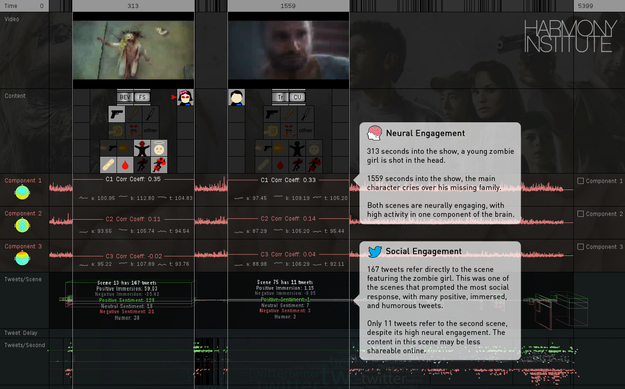
The first noticeable trend was the correlation of spikes in brain activity and Tweets. Big moments in the show -- for instance the clip below where Sheriff Rick Grimes takes out a little girl zombie with a shot to the head -- corresponded with a lot of brain activity and a lot of Twitter activity. The common understanding of Twitter as a good measure of engagement in viewers holds.
5. Find the less obvious: The heartstring effect

But the brain data also showed something the Tweet data did not: Spikes in brain engagement at moments of high emotion that didn't register on Twitter. When Sheriff Grimes breaks down about halfway through the episode, thinking his family is gone, the volunteers's brains registered high activity, but there were very few Tweets about that moment. The effect says something about how people use Twitter, that it's an outlet for certain types of emotions, but not others.
Would love to see how brain data and Twitter data would compare on something like the presidential debates.
**
Full disclosure: John Johnson, the Harmony Institute's founder and executive director, also sits on the BuzzFeed board of directors.